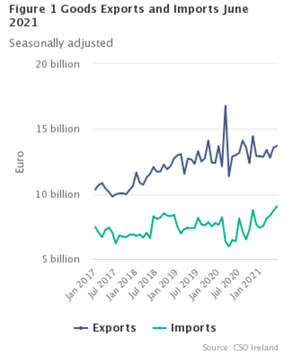
 Seasonally adjusted goods exports increased by €139 million (+1%) to €13,706 million in June 2021 compared with May 2021, according to preliminary figures from the Central Statistics Office. Seasonally adjusted goods imports increased by €320 million (+4%) to €9,044 million leading to a decrease of €181 million (-4%) in the seasonally adjusted trade surplus to €4,662 million in June 2021 compared with the previous month. Seasonal adjustment compares month-to-month data by removing fluctuations that June occur due to seasonal patterns in trade. Exports increased by €800 million in June 2021 compared with June 2020. The (unadjusted)* value of goods exports for June 2021 was €14,435 million representing an increase of €794 million (+6%) when compared with June 2020. The value of goods exports for the period January to June 2021 was €80,669 million, a decrease of €1,385 million (-2%) when compared with the first six months of 2020.
Exports of Medical and pharmaceutical products increased by €328 million (+6%) to €5,979 million in June 2021 compared with June 2020. These products accounted for 41% of total exports. Exports of Electrical machinery, appliances and parts increased by €280 million (+39%) to €1,001 million. Exports of Professional, scientific and controlling apparatus increased by €229 million (+57%) to €630 million over the same comparative period. Exports of Organic chemicals decreased by €762 million (-31%) to €1,712 million. Imports increased by €2.9 billion in June 2021 compared with June 2020. The (unadjusted) value of goods imports for June 2021 was €9,666 million representing an increase of €2,916 million (+43%) when compared with June 2020. The value of goods imports for January to June of 2021 was €48,081 million, which is an increase of €7,862 million (+20%) compared with the first half of 2020. Imports of Organic chemicals increased by €1,249 million (+202%) to €1,866 million in June 2021 compared with June 2020. Imports of Electrical machinery, apparatus and appliances increased by €466 million (+189%) to €713 million. Imports of Petroleum increased by €111 million (+65%) to €282 million over the same comparative period. The value of goods imports for June 2021 excluding SITC 79 (Other transport equipment, including aircraft) was €8,217 million, an increase of €2,407 million (+41%) when compared with the corresponding June 2020 figure of €5,811 million. Exports to Great Britain increased by €575 million in June 2021 over June 2020 Exports to Great Britain in June 2021 were €1,420 million, an increase of €575 million (+68%) compared with June 2020. The largest increases were in the exports of Chemicals and related products and Machinery and transport equipment. Exports to Great Britain accounted for 10% of total exports in June 2021. The value of goods exports to Great Britain in the first six months of 2021 was €6,724 million, an increase of €1,128 million (+20%) on the first six months of 2020. Imports from Great Britain decreased by €213 million (-16%) to €1,097 million compared with June 2020. The largest decreases were in the imports of Food and live animals and Manufactured goods. Imports from Great Britain were 11% of the value of total imports in June 2021. The value of goods imports from Great Britain for the first half of 2021 was €5,325 million, a decrease of €2,544 million (-32%) compared with January to June 2020. Geographic breakdown of goods exports and imports The EU accounted for €5,259 million (36%) of total goods exports in June 2021 of which €1,898 million went to Germany, €857 million went to the Netherlands and €761 million went to Belgium. Total EU exports in June 2021 decreased by €927 million (-15%) compared with June 2020. The USA was the main non-EU destination accounting for €4,274 million (30%) of total exports in June 2021. The EU accounted for €3,666 million (38%) of total goods imports in June 2021, which is an increase of €1,223 million (+50%) compared with June 2020. The UK with €1,435 million (15%), the USA with €1,064 million (11%), Switzerland with €964 million (10%) and China with €554 million (6%) were the main non-EU sources of imports. Exports by industrial origin and Imports by main use Industrial produce accounted for €13,446 million (93%) of total exports in June 2021. This is an increase of €743 million (+6%) when compared with June 2020. There was €4,894 million of this exported to the EU, and €4,224 million to the USA. Agricultural produce accounted for €888 million (6%) of total exports. Producer capital goods ready for use accounted for €1,969 million (20%) of total imports in June 2021, an increase of €569 million (+41%) when compared with June 2020. Consumption goods ready for use represented €1,966 million (20%) of total imports, and Materials for further production accounted for €5,621 million (58%). *It should be noted that the detailed data described in Paragraph 3 onwards, and the data in Tables 1, 3, 4, 5, 6 and 7 are not seasonally adjusted. Only the data described in the first two paragraphs and in Table 2 are seasonally adjusted. From 1st January 2021 all trade in goods with Great Britain (excluding Northern Ireland) is treated as non-EU trade and must be reported to Revenue’s Customs declaration systems. Prior to this, data on trade with Great Britain were collected via the Intrastat survey. Under the Revised Protocol on Ireland and Northern Ireland, Northern Ireland is legally part of the customs territory of the UK, but effectively remains within the EU Single Market for the movement of goods. In practise, this means that trade in goods with Northern Ireland continue to be reported on the Intrastat survey and on VAT returns. The results reflect both new data collection methods and changes in trading patterns due to Brexit. We are continuing to work on quality improvements as we incorporate the new data sources and detail available to us from January 2021. Comments are closed.
|
Archives
March 2024
|

 RSS Feed
|
This site uses cookies. By continuing to browse the site you are agreeing to our use of cookies.
See our Privacy Statement here & Cookie Policy here |
© Copyright IFSA 2020. All Rights Reserved.